The Map of the Month is the most recent initiative of SASSCAL and is produced by the OADC team. Every month, SASSCAL will publish a Map of the Month, in order to communicate a general weather or climate observation, depicted by a combination of data from the SASSCAL WeatherNet and/or other reliable climate data sources. The map may also visualise natural resource related observations. This is the first of many “Map of the Month” products.
The Map of the Month for May 2020 represents the winter temperatures for southern Africa. To derive the map and its inset map and graphs, SASSCAL analysed 58 years (1960—2018) of WorldClim Historical Monthly Weather Data.
The winter months in southern Africa, which generally start in April/May and continue up to August/September, are associated with the influenza season. It has been suggested that the Covid-19 or coronavirus displays similar trends, with a higher incidence in lower temperature areas (Biqing et al 2020). While in the northern hemisphere, scientists draw correlations between the SARS outbreak of 2003 and Covid-19, and are hopeful that infections will taper off towards the summer months, experts don’t know the consequence of the upcoming winter in the southern hemisphere on the spread of the virus.
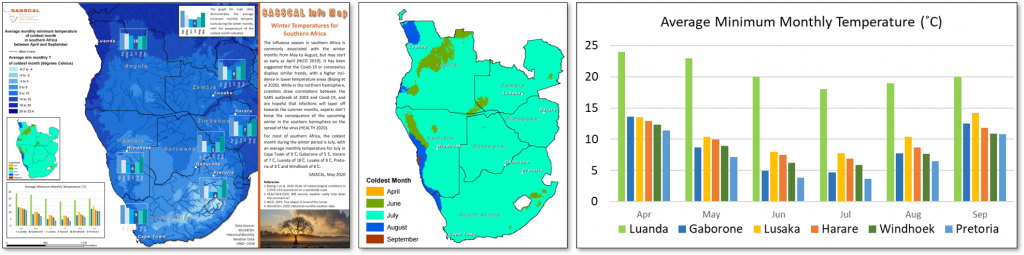
The map of the month for May 2020 represents the expected winter temperatures for southern Africa. One inset map shows the month with the average minimum temperature derived from 58 years of historic temperature records. The graph depicts the average minimum monthly temperature in degrees Celsius at National or Regional Capitals.
For most of southern Africa, the coldest month during the winter period is July, with an average monthly temperature for July in Cape Town of 9 ˚C, Gaborone of 5 ˚C, Harare of 7 ˚C, Luanda of 18 ˚C, Lusaka of 8 ˚C, Pretoria of 4 ˚C and Windhoek of 6 ˚C.
SASSCAL, May 2020